
 EN
EN
 ar
ar bg
bg hr
hr cs
cs da
da nl
nl fi
fi fr
fr de
de el
el hi
hi it
it ko
ko no
no pl
pl pt
pt ro
ro ru
ru es
es sv
sv tl
tl iw
iw id
id lv
lv lt
lt sr
sr sk
sk sl
sl uk
uk vi
vi et
et hu
hu th
th tr
tr fa
fa ms
ms hy
hy ka
ka ur
ur bn
bn mn
mn ta
ta kk
kk uz
uz ku
ku
Visualization Software
The Visualization Software lists Changsha, China, as the place of origin, Kingmach as the brand, GB50982-2014 as the certification, and a minimum order quantity of one piece. Pricing is negotiable, payment terms are T/T in advance, and delivery time is listed as instant. These business details are useful when the platform is purchased together with sensors, data loggers, acquisition modules, communication devices, or a wider monitoring package. They also show that the software is treated as a formal product category within the Kingmach monitoring range.
Application of Visualization Software
Multi-site asset management uses Kingmach Visualization Software when an owner needs consistent monitoring records across several projects. Each project can keep its own basic information, dynamic information, alarm levels, documents, and maintenance records while still following a common digital workflow. This is useful for infrastructure owners, engineering firms, and maintenance teams that manage bridges, tunnels, slopes, buildings, and hydraulic structures at the same time. Standardized visualization and reporting make cross-project review more efficient.
The future of Visualization Software
IoT development will make Kingmach Visualization Software more important because field devices will keep expanding in number and variety. A bridge, tunnel, dam, or slope may use wired channels, wireless nodes, edge loggers, weather stations, and third-party devices at the same time. The platform's compatibility with different manufacturers, types, and models supports this mixed-device future. As monitoring networks grow denser, device access, channel naming, alarm rules, and project organization will matter as much as the individual sensor.
Care & Maintenance of Visualization Software
Backup and export planning protects Kingmach Visualization Software records. Monitoring data, alarm histories, reports, and project documents may be needed for maintenance, audits, claims, or engineering review years after collection. Define who can export data, how often backups are checked, and where report files are stored. If the platform is integrated with other systems, confirm that exported timestamps, units, point names, and alarm states remain readable outside the original view.
Kingmach Visualization Software
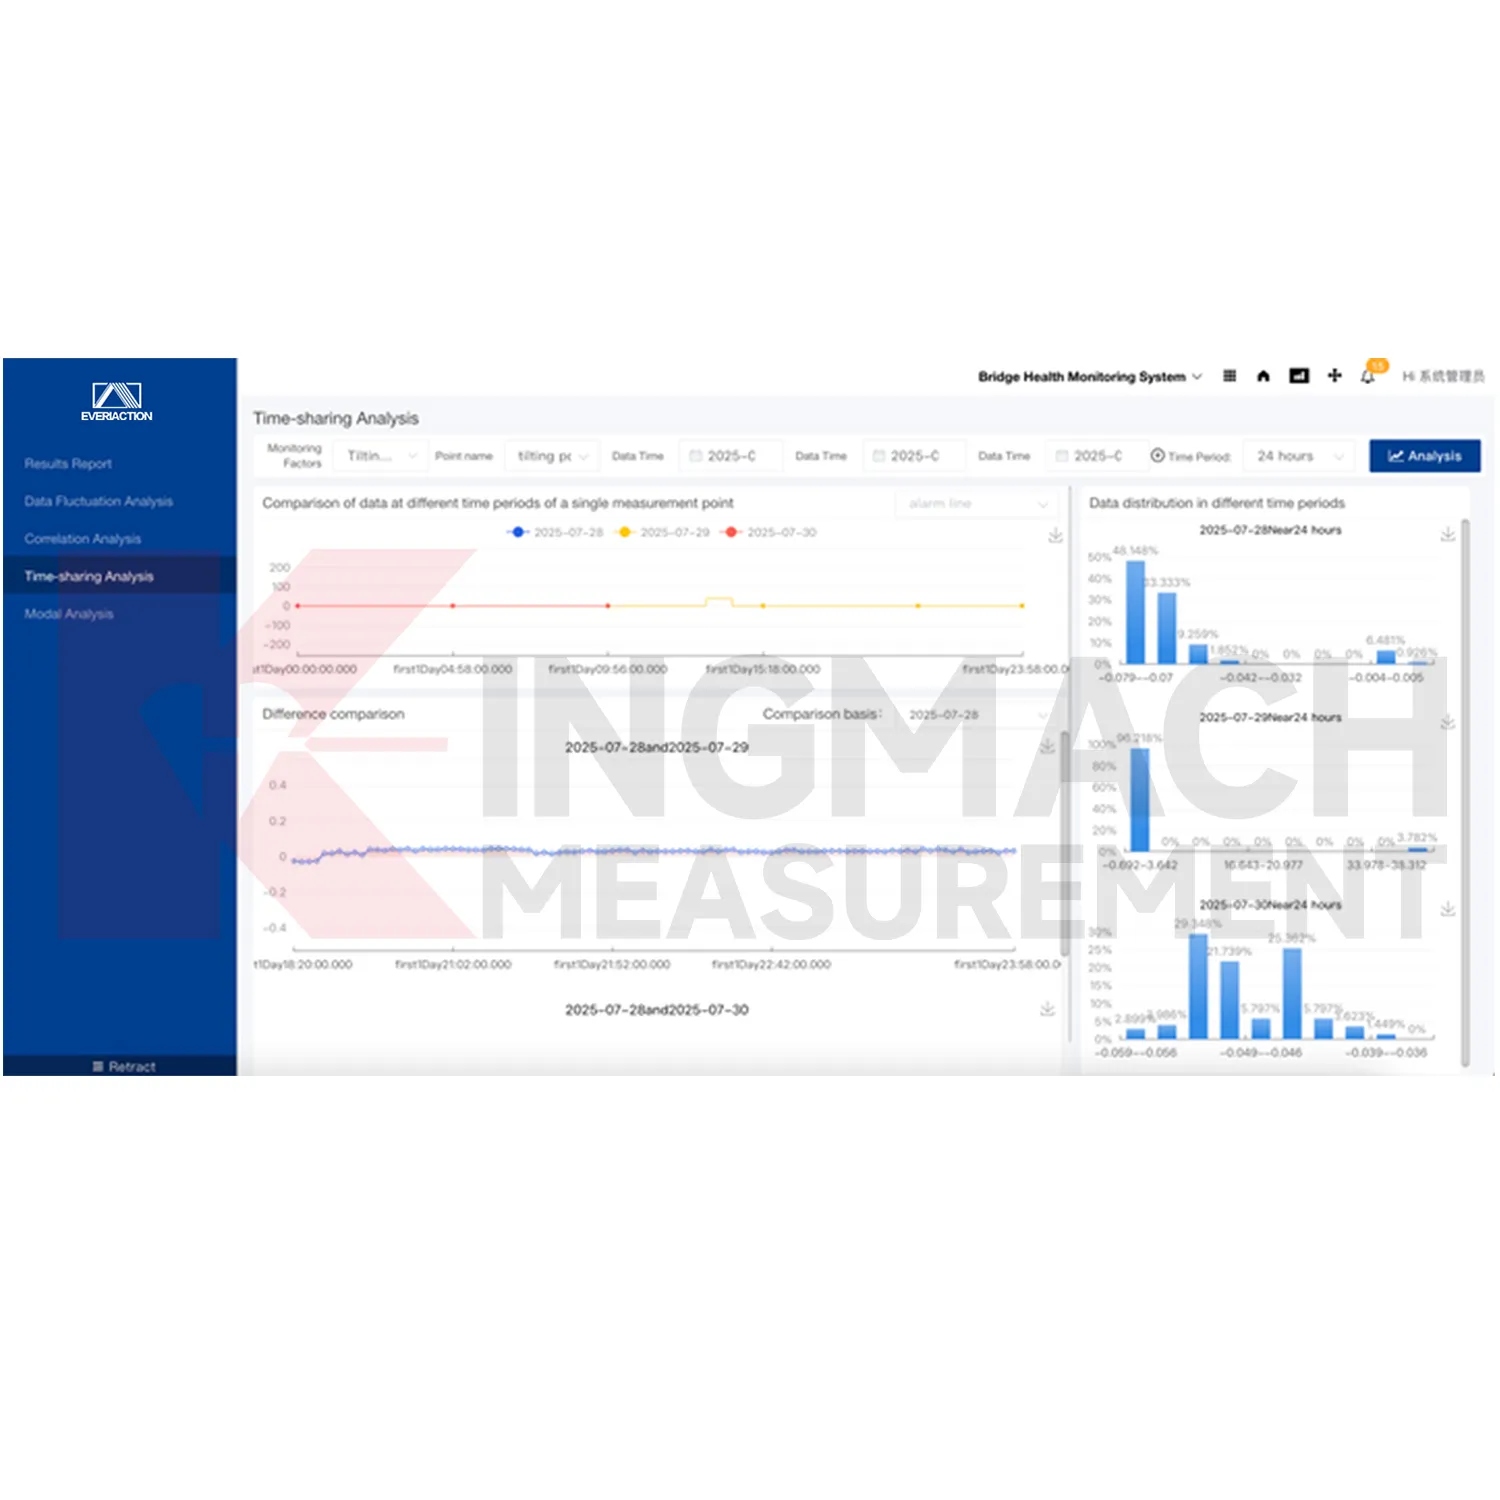
Kingmach Visualization Software is built around IoT, big data, and cloud computing technologies for civil engineering safety monitoring. Devices can transmit data to the Cloud Platform through wired or wireless means, allowing mixed field networks to feed a shared review environment. The platform is described as compatible with hardware devices from different manufacturers, different types, and different models. This is useful for owners who already have existing instruments or who need to expand a site in stages. The software layer helps connect new and old monitoring equipment into one readable data environment.
FAQ
Q: How should a project be prepared?
A: Define asset folders, monitoring zones, measuring points, units, alert grades, and report needs before launch.
Q: What should be tested at go-live?
A: Test incoming values, time order, engineering units, graph refresh, alarm trigger, and export output.
Q: Why does alarm logic need review?
A: Different sensor categories and risk levels may need different limits, rates, and escalation steps.
Q: How should files stay current?
A: Update drawings, point lists, photos, inspection notes, maintenance logs, and reports when the site changes.
Q: What should follow a platform update?
A: Run a short acceptance check on live values, graph pages, alerts, exports, accounts, and stored files.
Reviews
Robert Taylor
The weir flow meter is well-built and delivers accurate measurements. Great value for water management applications.
Christopher Martinez
Very satisfied with the readouts & data loggers. User-friendly interface and supports multiple sensor inputs.
Latest Inquiries
To protect the privacy of our buyers, only public service email domains like Gmail, Yahoo, and MSN will be displayed. Additionally, only a limited portion of the inquiry content will be shown.
Olivia***@gmail.comUnited States
Hello, we are currently sourcing high-precision strain gauges and load cells for a bridge monitoring...
Isabella***@gmail.comGermany
Hello, we are evaluating weir flow meters for a water management project. Please share accuracy deta...
Related product categories
- Monitoring Software Suite
- Monitoring system software platform
- Environmental Monitoring
- Visualization Software
- GPS Displacement Monitoring System
- Integrated Monitoring Station
- Settlement Monitoring Rod
- Structural Health Monitoring (SHM) System
- Structural Monitoring Cloud Platform
- IoT Online Monitoring System
- Monitoring System Platform & Services
- Engineering Pulse Intelligent Monitoring Cloud Platform